Why Enterprises Are Ditching Dashboards for Data Products?
The $1.12 Trillion Shift.
Shen Pandi
February 18, 2026
Old BI: "What happened?" Data products: "What should we do next?"
Dashboards look backward; data products drive action.
Insights arrive too late; decision windows close.
Dashboards inform but don't mobilize.
KPIs are visible but not actionable.
Reports exist but aren't connected to systems.
Your AI Is Only as Good as Your Data: Why Data Products Matter Now
Early enterprise analytics revolutionised reporting, moving beyond spreadsheets and anecdotes to charts and KPIs, giving leaders a common language to describe performance and answer the question: What happened?
It was, and for a long time, remains an important question. And for a while, it was the only question business leaders really had to answer.

But the business world has evolved. Markets are changing faster. Competitive advantages are lasting shorter.
Data sets have grown exponentially, while decision windows have narrowed dramatically. In such a world, simply knowing what’s happening doesn’t create a competitive advantage. The question business leaders must now answer is: What should we do next?
The Question That Now Matters Most
For many organisations, the limitations of traditional business intelligence-static dashboards and periodic reporting cycles- mean it’s failing to answer the question of what’s next. Instead, it informs, but it doesn’t mobilise.

It helps leaders understand the past, but it doesn’t shape the future. The widening gap between business intelligence and business action is driving the move away from business intelligence and towards data products.
Why Traditional BI Is No Longer Enough
For years, dashboards have been central to analytics, providing a summary of performance, tracking targets, and offering senior management a broad view of the entire organization.
In an organization that is changing slowly, this has been fine. Decisions arrive in batches, information flows in regular increments, and reports align with planning cycles.
But everything has changed.
Dashboards inherently look backward. They reflect what has occurred in the past, often with significant lags of hours, days, or weeks.

In fast-paced operations, this lag has significant consequences. By the time an issue appears on the dashboard, the window of opportunity to respond to that issue may be closed.
But there is another problem with dashboards: they do nothing. They present information, but that is it. They require human interpretation to determine what is important, what to do next, and how to get there. The final bridge between information and action is where speed is lost.
Over time, the pattern has become clear, and the familiar cracks are:
Insights come too late to affect the outcome
KPIs can be seen, but they’re not necessarily actionable
Reports exist, but they’re not necessarily connected to the systems that would use them
Accountability seems to disappear once the dashboard is delivered
Dashboards accumulate, and the user gets confused and distrustful
This creates the ongoing problem of the ‘last mile’ of analytics. The organization can see what’s happening, but it’s hard to act on it.
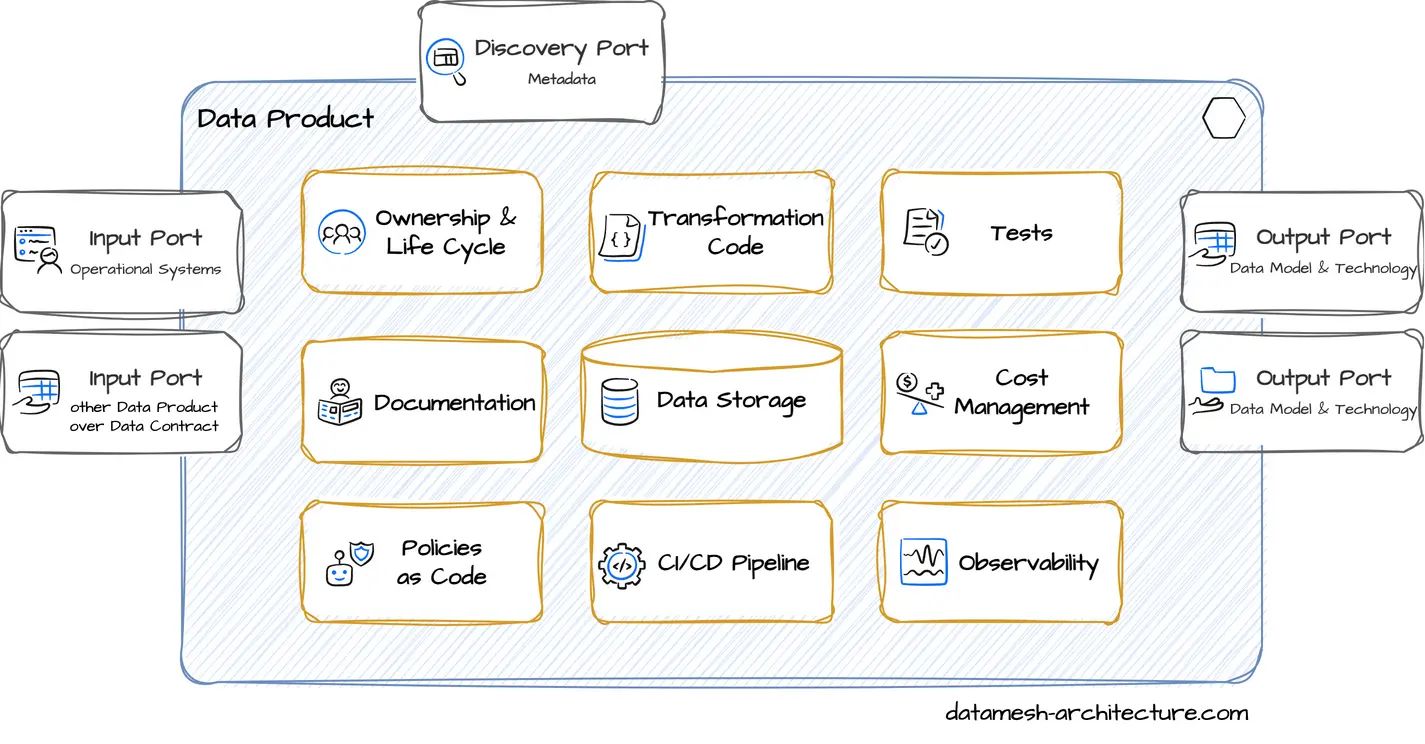
What Actually Makes Something a Data Product?
A data product isn’t just a set of data or a report with sophisticated visualizations. It’s an analytical product designed to support a specific decision, process, or operation in the world.
Traditional BI often focuses on information delivery, whereas data products focus on usage. They’re designed with a specific user in mind and are designed to integrate nicely into how people use information.
Well-crafted data products have the following key attributes:
Purposeful: Each product has a purpose, i.e., it is used to answer a business question or support a business decision
Curated and trusted data logic, definitions, and quality standards are explicit and governed
Actionable: Insights are embedded, not something that is left to interpretation
Workflow: Delivered within the workflow, inside the systems where users work
Owned and accountable with clear responsibility for outcomes, not just delivery
Continuous improvement: Data products are seen as living products, not static artifacts
In simple words, dashboards display the data, whereas data products change the outcome.
To build products that actually drive action, you need a foundation that’s smarter than a spreadsheet. That’s where DataManagement.AI comes in, turning your raw data into decision-ready assets."

From Outputs to Outcomes: Redefining Analytical Value
In the traditional BI world, success used to be measured by what was produced, how many reports were dispatched, how many dashboards were built, and how many questions were answered. These are easy to track, but they are also very misleading.
Output does not necessarily equal impact.
In the world of data products, success is more rigorously defined. Success is ultimately measured not just by outcomes but by the change that they produce:
Adoption - are people actually using the product as part of their work?
Impact - does it influence decisions, priorities, or behaviour?
Execution - does it trigger concrete actions, automation, or intervention?
This result-oriented thinking connects analytics to existing product thinking. The goal isn’t to inform for the sake of information; it’s to inform to help make better decisions faster and more reliably.
Data Products vs Dashboards: The Practical Difference
The distinction between dashboards and data products is perhaps nowhere clearer than in the following operating scenarios.
A dashboard could merely indicate that customer churn is trending upwards.
A data product, on the other hand, would not only identify which customers are at risk but would also analyze the underlying causes of the risk and initiate the process of retaining those customers right from the CRM screen.

Again, the difference between the two could appear trivial in theory, but it is huge in practice.
A dashboard can present current inventory levels.
A data product not only shows the current levels but also forecasts impending out-of-stocks and drives replenishment decisions into the supply chain process.
Closing the Loop: Where Automation Takes Over
But as they get better at using data products, they tend to extend their reach through automation.
As organizations move beyond just delivering insights, they begin to operationalize decisions with intelligent agents.
For instance, platforms like AgentsX enable organizations to deploy AI-driven agents that operate on the results of data products, effectively allowing them to automate decisions, coordinate processes, and execute actions without human intervention.

Let's use Robotic Process Automation (RPA) as an example. RPA is often used in conjunction with data products to complete the cycle from insight to action. Data products determine what to do, while RPA ensures that it gets done, done well, and at scale.
RPA uses software ‘bots’ to perform rule-based activities within digital environments, including data copying, transaction processing, reporting, and approvals. Used with data products, these functions minimize manual effort, eliminate errors, and speed up response times.
The broad picture is one of moving from fragmented, manual processes to smart, data-driven execution.
Key Characteristics of Effective Data Products

Although data products vary across industries and functions, the most effective ones consistently exhibit the same traits:
A clearly defined decision or operational use case
Named ownership with accountability for quality and outcomes
High‑quality, governed, and trusted data foundations
Discoverability and intuitive use
Seamless integration into existing tools and workflows
Continuous feedback and iteration based on real usage
This is the key to avoiding the staleness of analytics: the dashboards that get built once, get used once, and then disappear into the background.
Where Data Products Deliver the Greatest Value
Data products have the greatest impact when decision-making is frequent, rapid, and continuous, and when it keeps the business moving forward.
Customer Experience: They alert us to customers at risk, notice behavioral shifts, and recommend the next best action, all within customer-facing tools.
Sales and Revenue: They rank leads, warn about revenue risk, and guide pricing or discount decisions in real time.
Operations: They forecast where congestion is coming, anticipate equipment failures, and see supply chain issues before they arrive.
Finance: They let us forecast continuously, track variances, and run scenario models, rather than just looking at static reports.
Risk and Compliance: They offer continuous monitoring and anomaly detection without slowing down the business.
In each of these, the benefit comes from integrating intelligence into workflows, rather than making users go searching for it.
The old problem with business intelligence has been that there has been no ongoing ownership of it. The intelligence has been built, handed over, and over time, it has become disconnected from the business's needs.
With data products, there is true product ownership. The team isn’t just building analytics; they’re responsible for keeping them relevant, accurate, and useful over time. Feedback loops allow them to evolve with the business.

This one change alone improves trust, usage, and ultimate usefulness.
The data products concept integrates nicely into today’s decentralized data world. Rather than forcing all analytics requests through a single central backlog list, domain teams are now responsible for the products that matter most to their piece of the business.
This approach helps you scale without losing governance and avoids the bottlenecks that have always plagued traditional BI environments.
The shift to decentralized data products is inevitable; it's how you scale without sacrificing speed. But with domain teams owning their data, how do you prevent chaos?
You need a connective layer. A way to discover, govern, and connect these distributed products without creating new bottlenecks.
That's exactly what DataManagement.AI enables. The control of a central backbone with the agility of a decentralized world.

The Organisational Challenge of Change
The move from dashboards to data products is not just about technology – it is an entire organization effort.
Some of the key challenges include redefining ‘who owns what,’ moving away from ‘project delivery’ to ‘product delivery,’ finding the right balance between ‘autonomy’ and ‘control,’ and learning to ‘measure impact’ rather than ‘output.’
The successful transition will yield strong sponsor engagement, clear guiding principles, and ongoing collaboration between business, data, and technology teams.

The age of dashboards as the standard output of analytics is coming to an end. In an age where speed and decisiveness are key, having insight is no longer good enough; only having actionable insight will do.
Enter data products, the next big leap in the evolution of analytics. Data products can transform analytics from reporting to actual decision support. They can link intelligence to where work gets done, effectively bridging the gap between knowing and doing.
The key takeaway for leadership teams is: what gets measured now is no longer who can gather the most data, but who can use it best.
The conversation changes from,
“What do we need to report?”
It is, “What do we need to decide, and how quickly can we do it?”
Warm regards,
Shen and Team