Why do Dashboards Fail Without Warning?
and how to prevent it
Shen Pandi
March 17, 2026
It’s Monday morning, and your product and analytics teams are going through their usual routine, checking dashboards, reviewing KPIs, looking at retention curves and user activity. Everything looks fine.
On the surface, the numbers make sense and nothing seems out of place.
Then finance runs their weekly checks, or leadership pulls the reports for a strategy review, and suddenly, the story changes. Revenue doesn’t reconcile, usage patterns don’t match projections, and forecasts feel off.
How can the dashboards that “looked fine” all weekend now be misleading decisions?
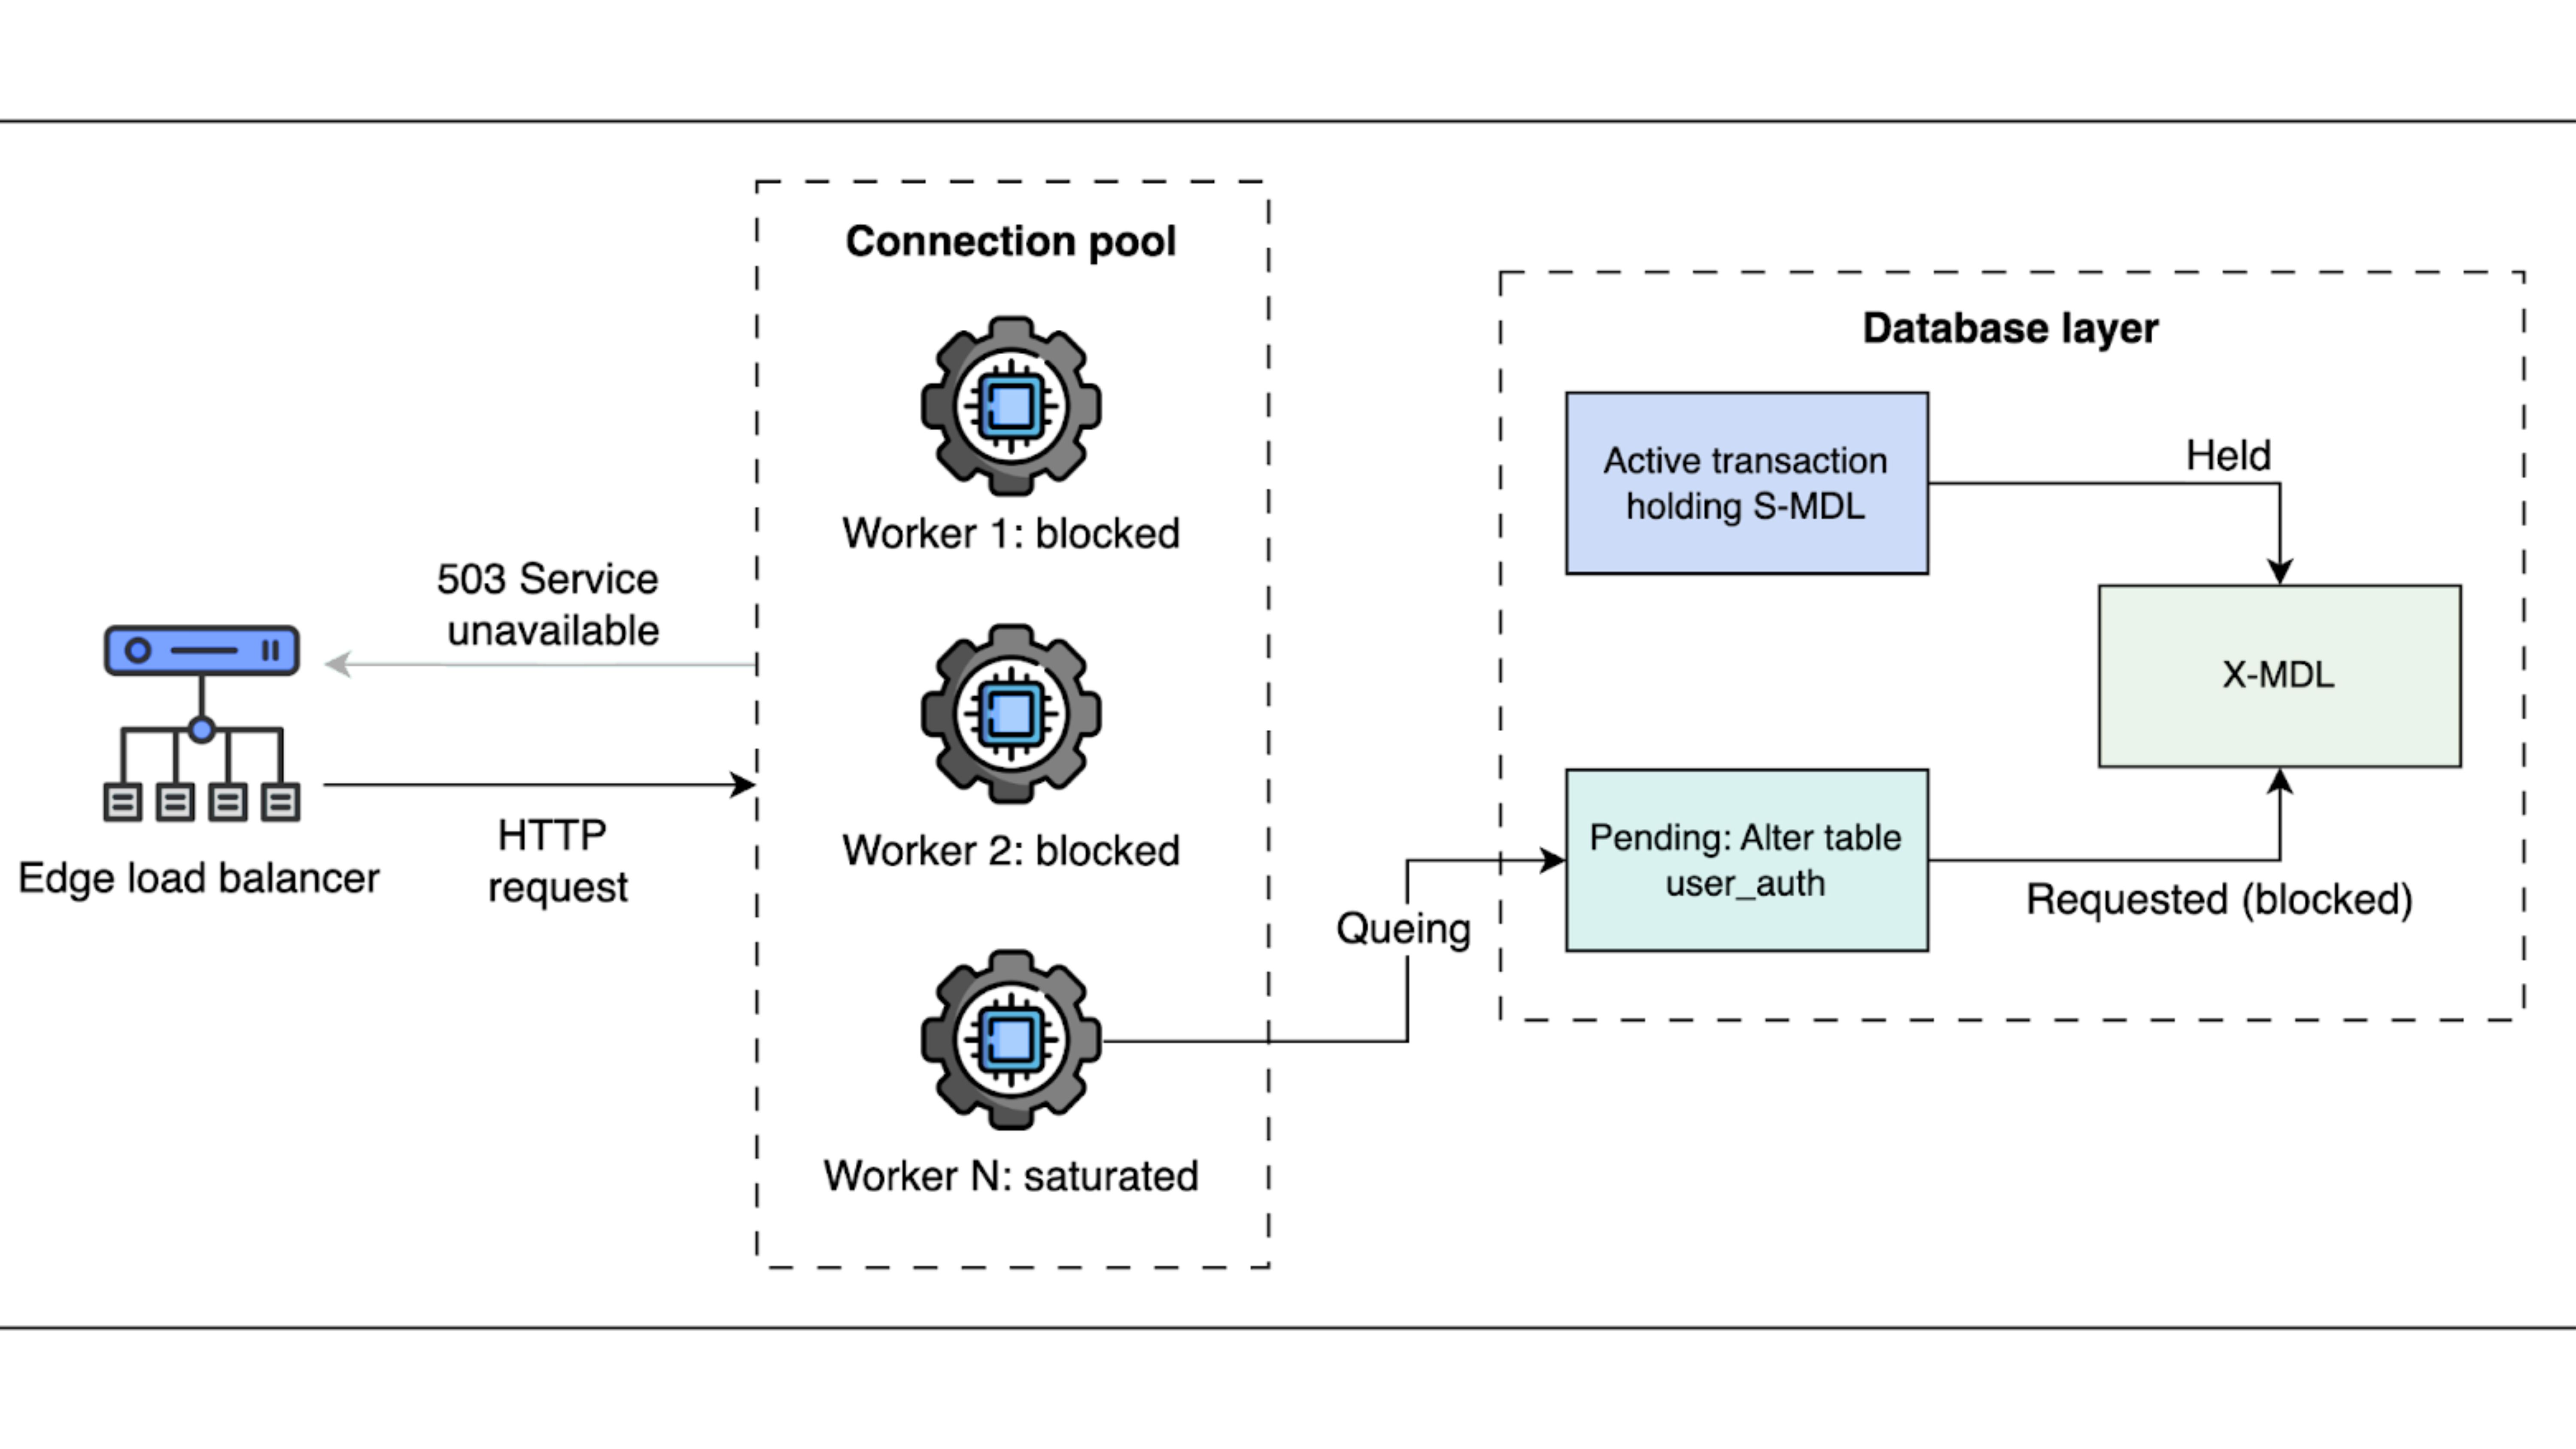
Most often, the culprit is a single, seemingly harmless schema change somewhere upstream, a new column, a minor data type adjustment, or a renamed field that suddenly propagates through every dependent system.
In most modern enterprise data pipelines are interconnected. Thus, a change in one source propagates through ETL transformations, feature tables, analytics layers, and dashboards.
Each downstream consumer interprets the data differently, based on library versions, query logic, or dashboard assumptions.
And, the result is not a system crash, but a series of subtle distortions like metrics are understated, duplicates appear, or categories split incorrectly.
How Factual Data Went Wrong at a Major Retailer
In 2021, Walmart’s analytics team deployed a schema update to the transaction table, adding an optional field to capture enhanced coupon metadata. The change was backward-compatible as downstream ETL jobs completed without errors, and all dashboards continued to load.
Engineers initially assumed the update was harmless. But the domino effect started right after.
Walmart’s retail analytics ecosystem relies on more than 20 distinct dashboards, each consuming the same raw tables but processed through slightly different ETL libraries, versions, and query logic.
Some dashboards silently ignored the new field, undercounting certain coupon redemptions. Others joined the field to lookup tables that had not been updated, inflating “unknown coupon” categories.
Certain aggregations returned nulls where data had previously been complete, and one dashboard even doubled promotion counts due to a deserialization quirk in its client library.
The discrepancies went unnoticed for days because every system executed without errors.
Finance only discovered the misalignments during weekly reporting, revealing inflated redemption counts that caused marketing to over-allocate budgets and operations to misplan inventory.
So, what appeared to be a minor schema change had propagated silently, creating cascading distortions across multiple functions.
Why Does This Happen More Often Than You Think?
This scenario illustrates a crucial point: dashboards are not measures of truth, they are measures of what reaches them.
Every dashboard encodes assumptions about the data it consumes. So, column names, data types, enum values, and timestamps are treated as constants. And a seemingly innocuous schema addition can violate these assumptions.
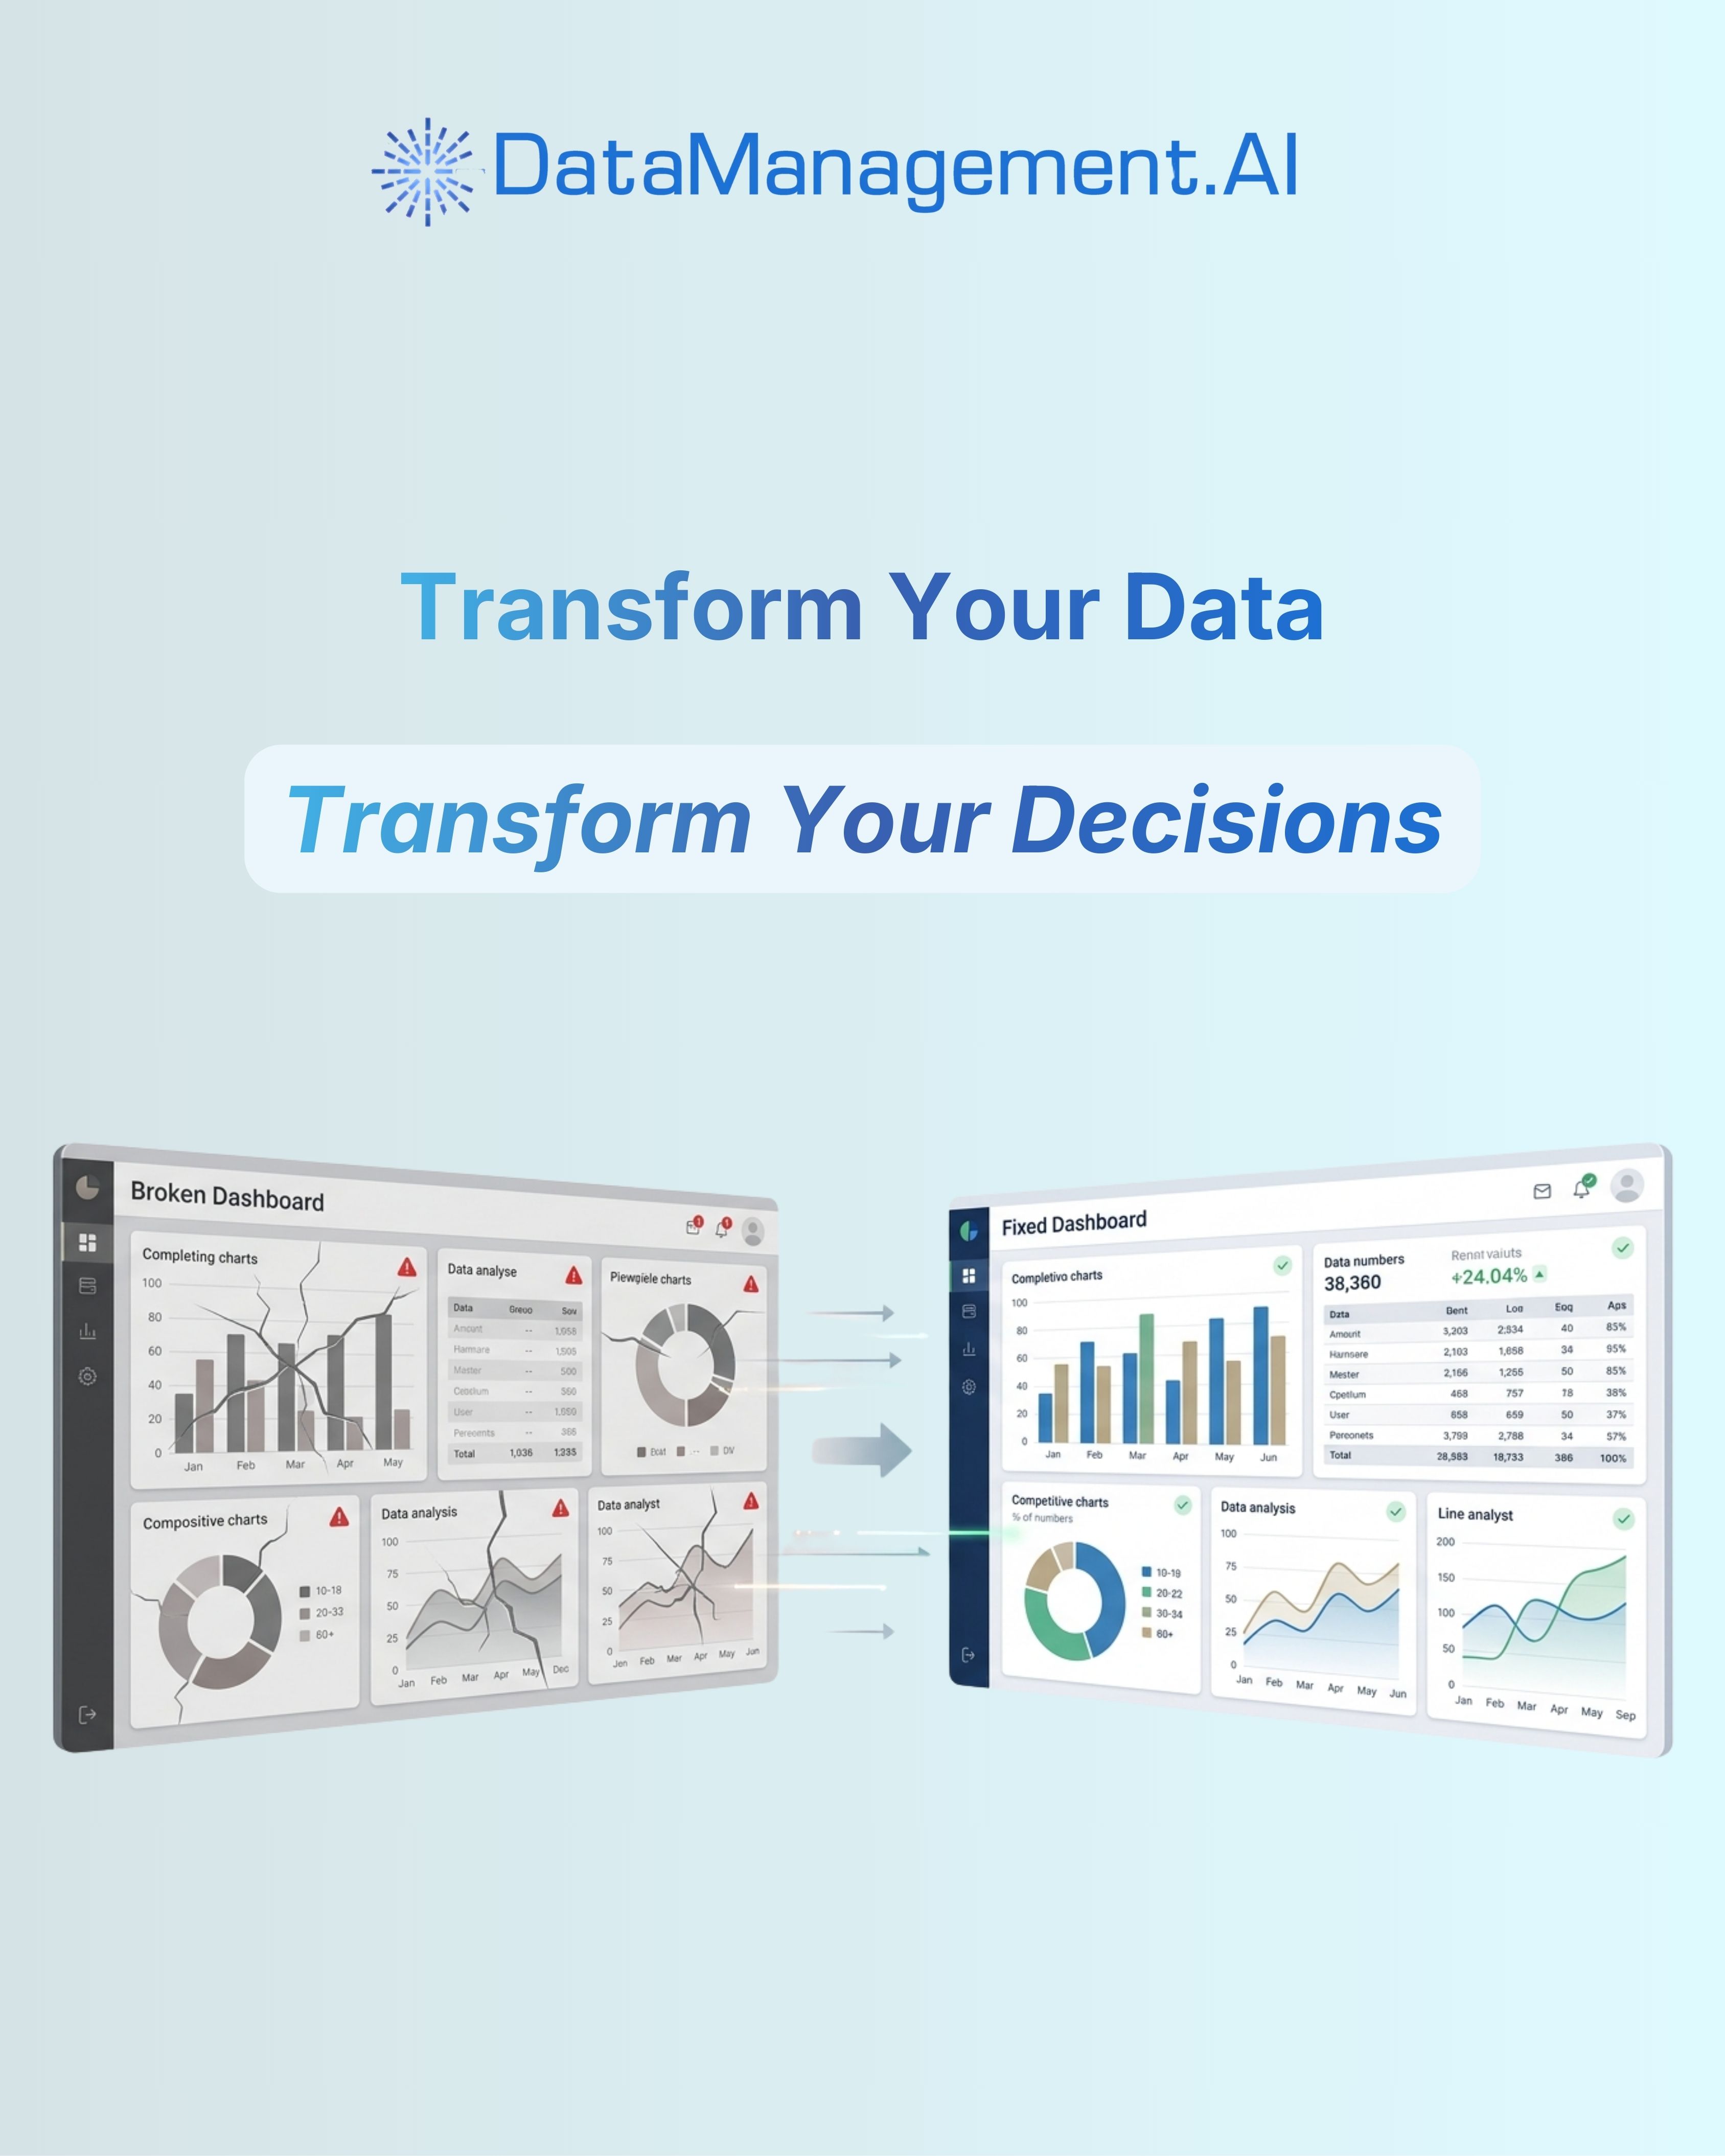
The paradox is that modern dashboards give teams a false sense of confidence with green numbers, smooth lines, and charts update on schedule.
But that smooth line may represent corrupted reality. Executives, marketing, and product teams make decisions assuming the data is accurate. And, by the time errors surface, the damage has already rippled through budgets, forecasts, and strategic initiatives.
How to Stop Schema Changes from Breaking Everything?
DataManagement.AI become indispensable in this scenario. The platform also provides Master Data Management to ensure consistency across critical business entities such as customers, products, and suppliers.
It extracts raw entity records from transactional systems and CRMs, matches unique identifiers like emails, SKUs, or tax IDs, and merges duplicates while enriching records with external reference data, including validated addresses.
Every entity is consolidated into a single “golden record,” complete with change-history metadata, so all downstream dashboards and analytics operate from the same authoritative source.
DataManagement.AI also validates schema consistency, checks field types, enforces null and range rules, and tracks historical error logs and timestamped quality metrics.
Thus, any schema change or transformation that violates assumptions triggers alerts before dashboards misrepresent metrics.
Teams gain full visibility into affected joins, aggregations, and pipelines, reducing manual reconciliation, building confidence in the data, and enabling finance, operations, and product teams to make decisions without risking misaligned insights.
Building a Data Pipeline That Survives Change
Beyond automated monitoring, companies can adopt complementary measures.
Having explicit data contracts can help define expected fields, types, and relationships so every team knows what assumptions downstream systems depend on.
Versioned schema deployments and staging environments will allow testing before production updates.
And, having lineage tracking in place will make it easy to trace every KPI back to its source, ensuring that any deviation can be pinpointed quickly.
Together, these practices create a resilient data ecosystem.
Take Control of Your Data Today!
See the full power of Chain-of-Data in action and experience how accurate, unified, and trusted data can transform your business.
Sign up now and get 50% off your first subscription.
Ready to make every dashboard, report, and workflow reliable?
Don't let outdated approaches hold you back.
Stop letting legacy processes slow you down. With DataManagement.AI, you don’t just manage data, you build confidence in every decision.
Warm regards,
Shen and Team