Is Your Company’s Data Stack Too Complicated to Actually Control?
let's find out
Shen Pandi
May 19, 2026
Enterprise data teams are deploying more tooling than ever: orchestration platforms, observability layers, reverse ETL systems, transformation frameworks, streaming infrastructure, cataloging tools, vector databases, MDM platforms, and warehouse monitoring stacks.
Yet according to IDC, over 70% of enterprise data leaders still report low trust in business reporting.
The problem is no longer missing tooling.
The problem is that most organizations built a fragmented control plane where every platform can observe one layer of the stack, but none can explain how behavior propagates across the system as a whole.
Your Stack Is Growing Faster Than Your Visibility Layer
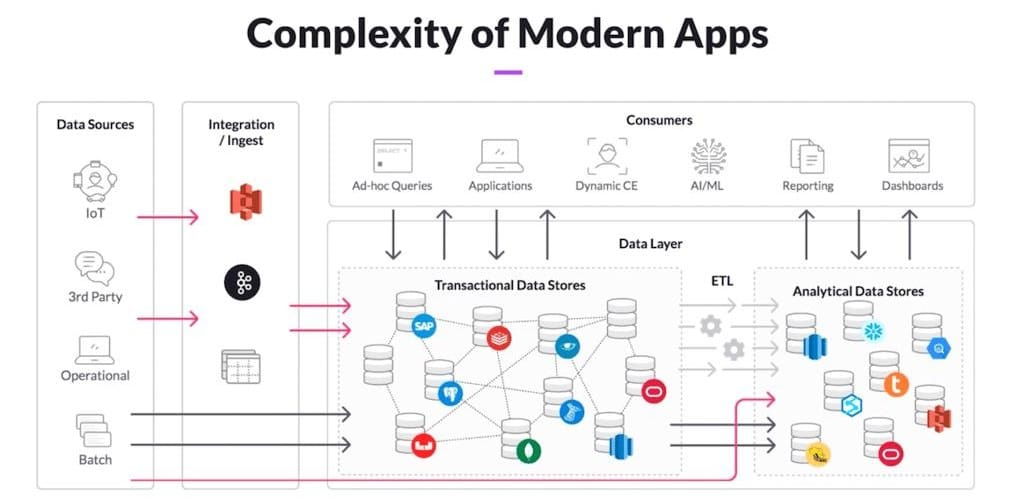
A typical enterprise pipeline now spans:
Kafka or Kinesis for ingestion
Airflow or Dagster for orchestration
dbt for transformations
Snowflake or BigQuery for storage
Monte Carlo or Datadog for monitoring
Reverse ETL platforms for operational syncs
BI layers for executive reporting
Feature stores for machine learning systems
Each platform generates its own metadata, alerts, lineage assumptions, and operational logs. But semantic failures do not stay confined to a single layer.
An upstream schema modification inside a streaming pipeline can alter downstream join behavior inside dbt models, which changes attribution logic inside reporting dashboards, which then propagates inconsistent metrics into forecasting systems and ML features.
Every tool shows its own local health status. But, none can explain the full behavioral chain across the warehouse.
This Is Why Your Teams Spend Weeks Chasing One Reporting Issue
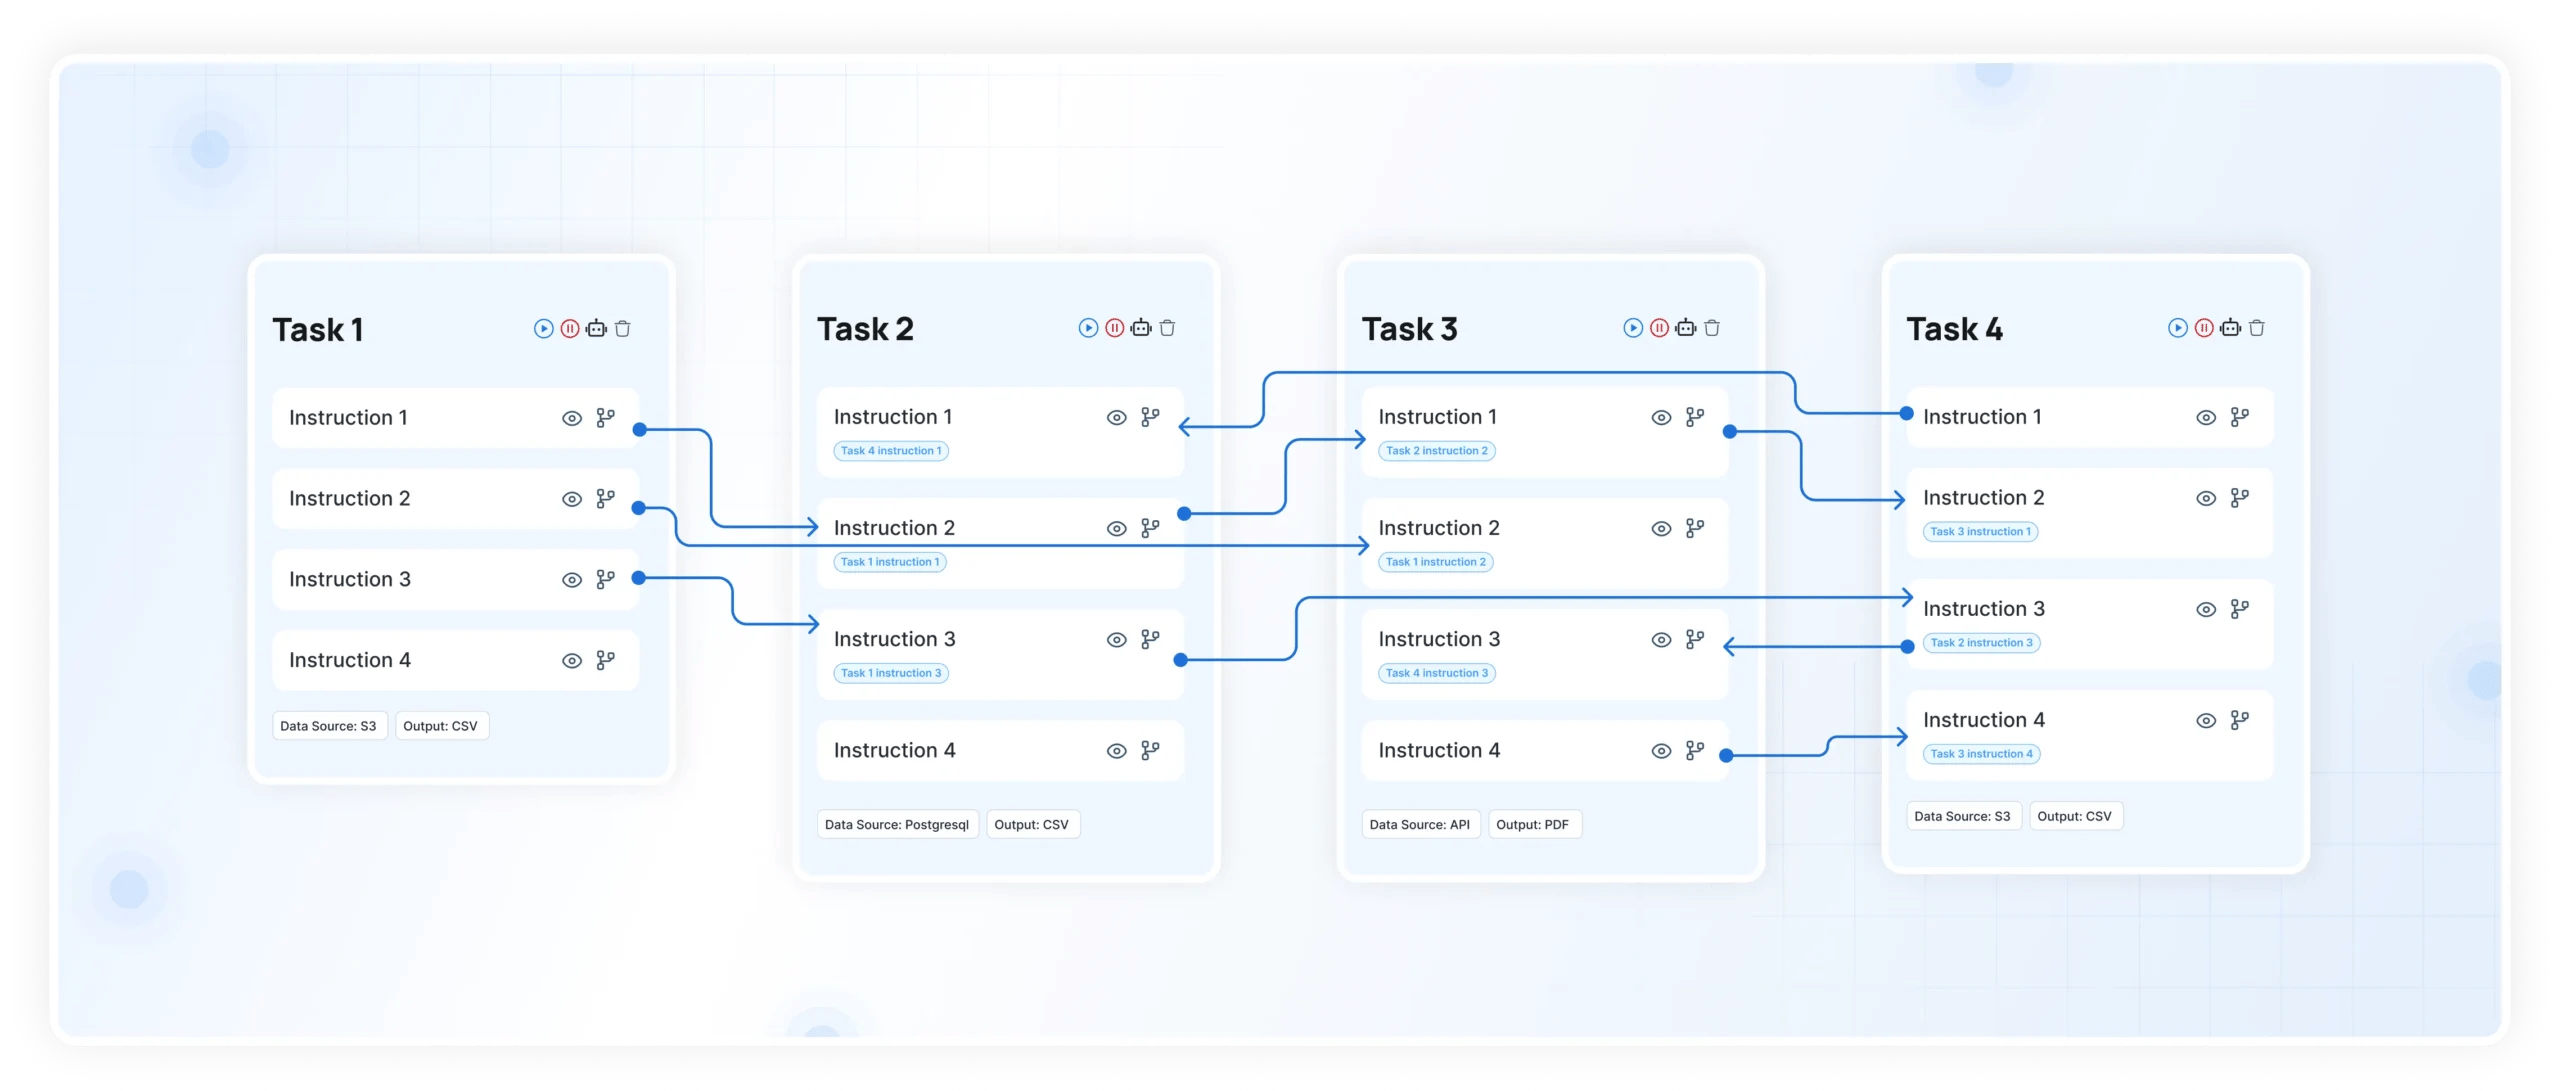
Once reporting inconsistencies appear, debugging becomes operationally expensive because engineers must manually correlate behavior across disconnected systems.
A single production incident now requires teams to inspect:
orchestration retries
warehouse query histories
dbt lineage graphs
schema evolution logs
CDC replay behavior
BI dashboard refresh histories
reverse ETL sync outputs
downstream metric deviations
This is not observability.
It is distributed forensic analysis performed manually after semantic instability already reached production systems.
According to Gartner, organizations lose an average of $12.9 million annually due to poor data quality and unreliable reporting workflows.
Most of that cost does not come from infrastructure outages.
It comes from operational drag created by fragmented visibility across transformation systems.
This Is What’s Costing You
Your engineering teams stop focusing on scalability and start spending entire quarters stabilizing semantic inconsistencies across tools that were never designed to share operational context.
Every additional platform introduces:
another metadata layer
another lineage assumption
another alerting surface
another synchronization dependency
another place where business logic can diverge silently
Over time, the warehouse becomes operationally fragmented.
Leadership sees dashboards. But, your engineers see dozens of disconnected systems trying to approximate a shared understanding of the business without a unified visibility layer tying them together.
You should not be diagnosing semantic failures by stitching together logs across six different platforms after reporting already broke. Talk to our team and see how DataManagement.AI helps enterprise organizations centralize observability, lineage visibility, and semantic monitoring across modern distributed data stacks.
Why Do More Tools Usually Create Less Visibility?
Most observability platforms monitor infrastructure behavior inside their own operational boundary.
They can detect:
failed DAGs
streaming lag
compute saturation
broken refresh schedules
warehouse latency spikes
They cannot explain how semantic drift propagates across interconnected transformation systems operating across multiple platforms simultaneously.
This is where DataManagement.AI becomes operationally critical.
Instead of treating observability as isolated tooling, the platform creates a unified operational visibility layer across schemas, transformations, joins, CDC streams, downstream dependencies, and reporting systems.
For example:
If a replayed CDC stream duplicates event sequences, downstream attribution models, executive dashboards, and ML features inheriting the corrupted records are identified immediately.
If a schema evolution event changes join cardinality behavior inside dbt transformations, affected reporting systems and dependent aggregations are surfaced before reconciliation failures spread across leadership reporting.
Your teams stop navigating fragmented monitoring systems independently and start understanding how semantic behavior propagates across the warehouse as a connected operational graph.
Your Problem Is Not Tooling. It Is Visibility Fragmentation
The longer operational visibility remains fragmented across disconnected tooling layers, the more engineering effort gets consumed by manually reconstructing behavioral dependencies after production metrics already diverged.
A strong breakdown of how enterprise teams are approaching this shift can be found in this guide to modern Master Data Management tools, especially around how AI-native MDM systems are helping organizations reduce duplicate entity definitions, reconciliation drift, and fragmented business logic across analytics systems.
The only scalable solution is unified lineage-aware observability that continuously maps how schemas, transformations, event streams, and downstream reporting systems interact across the entire warehouse before semantic instability turns into operational failure.
Warms regards,
Shen Pandi & DataManagement.AI team